
We (Anne, Juta and I) have the same information but as it is in the forum of an e-mail it is not right to post it.
Anne's interpretation will be exact.
We (Anne, Juta and I) have the same information but as it is in the forum of an e-mail it is not right to post it.


Miss you both

Pica, this beautiful picture makes me cry.
I hope it is, Jo.

Yes, pica.
sorry, we did not hear them early enough.
kuhankeittäjäkuhankeittäjä wrote: ↑October 18th, 2019, 8:55 pmAnne7,
So sad, again.
Please, kindest provide us a diagram where either data points or data gaps are visible, if possible. It helps interpreting informaton.
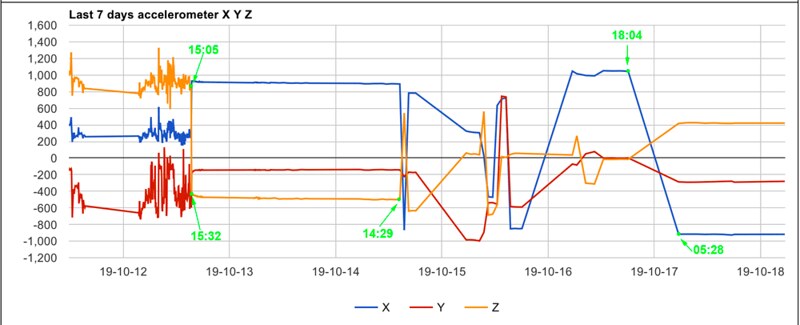
Anyhow, Oru fell down to its right wing side, stopping to transmit varying acceleration information and, hence, indicating changing body position in the Earth's gravity field, for quite some time. Evidently it was dead. After some rotations it stopped again, this time the left wing side down. Was it buried in the soil of the field?
i think: right, too long duration.if the tractor Oru had run over, he would not do 1 1/2 day. If Oru had attacked an animal, that would not take nearly 1 1/2 days, would it?

when i think of the possible predators and their behaviour i don't think so cause of the duration of moving and duration of rest. moving position would mean the predator(s) are all the time eating and moving the transmitter.Two days after Oru died, his body was probably found by a predator and/or rats. This can explain the weird movements of the transmitter.
When nothing was left to eat, any remains and the transmitter were left alone.
as far as i understand it, the black rectangles shows the period of time, where the transmitter shows no movement, and the purple line shows the time of transmitters' movements.
Visitvisit wrote: ↑October 18th, 2019, 10:24 pm well, but even wind doesn't match to this constant kind of motion, too...
i've no experience with the transmitters - e. g. don't know how many datasets build the line, is the line the dirct connection from datapoint to datapoint or is it like a trendline, etc.
it is this very constant motion for hours, why i thought of something like a technical process.
don't know which technical processes could be possible in this area.
Possibly because the battery level is very low at the moment (the battery does not recharge). The requested frequency of collecting the available data (from the internal sensors) probably changed.visit wrote: ↑October 18th, 2019, 11:07 pm in this case i would like to ask why the graph has connected before the presumed deathtime the datapoints much more detailed and later so different ?
*knowing, you probably don't have an answer
but perhaps the manufacturer ?
Anne
Edit: I will post a graph of the last 10 days (instead of 7), tomorrow.visit wrote: ↑October 18th, 2019, 11:07 pm perhaps, just in case...:
- do you have a graph of the time, when everything was ok ? *would be interessted in
because of the comparison of the normal to the little time at the beginning of this graph, until 12.10. 15:00
- and do you have a graph with the direct lines, no trendlines ?
- are the green lines from me (under the graph) show a normal graph above ?
*sry for asking


Hello, MichiMichi wrote: ↑October 19th, 2019, 12:10 am
I am very grateful, Anne, kuhankeittäjä and visit, that you are trying to clarify what happened to Oru.
I don't understand much about the graphics, but I looked again at Aru's graph and compared it with Oru's. For better comparison I post them both together.
About Aru's graph it was suspected - because of the flat line - that he was most likely dead. The last dates were from October 7th. But he wasn't dead; he lived another 4 days, until October 11th.
Can't conclusions be drawn from this realization that Oru's death is by no means certain?
Anne, now that you say it ... I already had the thought of Oru's low temperature. Then I forgot it again.
I saw differences, too. But because of the strange movings later I thought there could be a possibility.
No problem, Michi.